15 Revenue Operations KPI's to Track in 2026 Guide
Copy this KPI library and scorecard to align teams, fix definitions, and improve forecasts. Track 15 Revenue Operations KPI's to track in 2026 with formulas.

Ahmed Shafik
Co-founder
.png)
Trusted by 10,000+ Canadian businesses
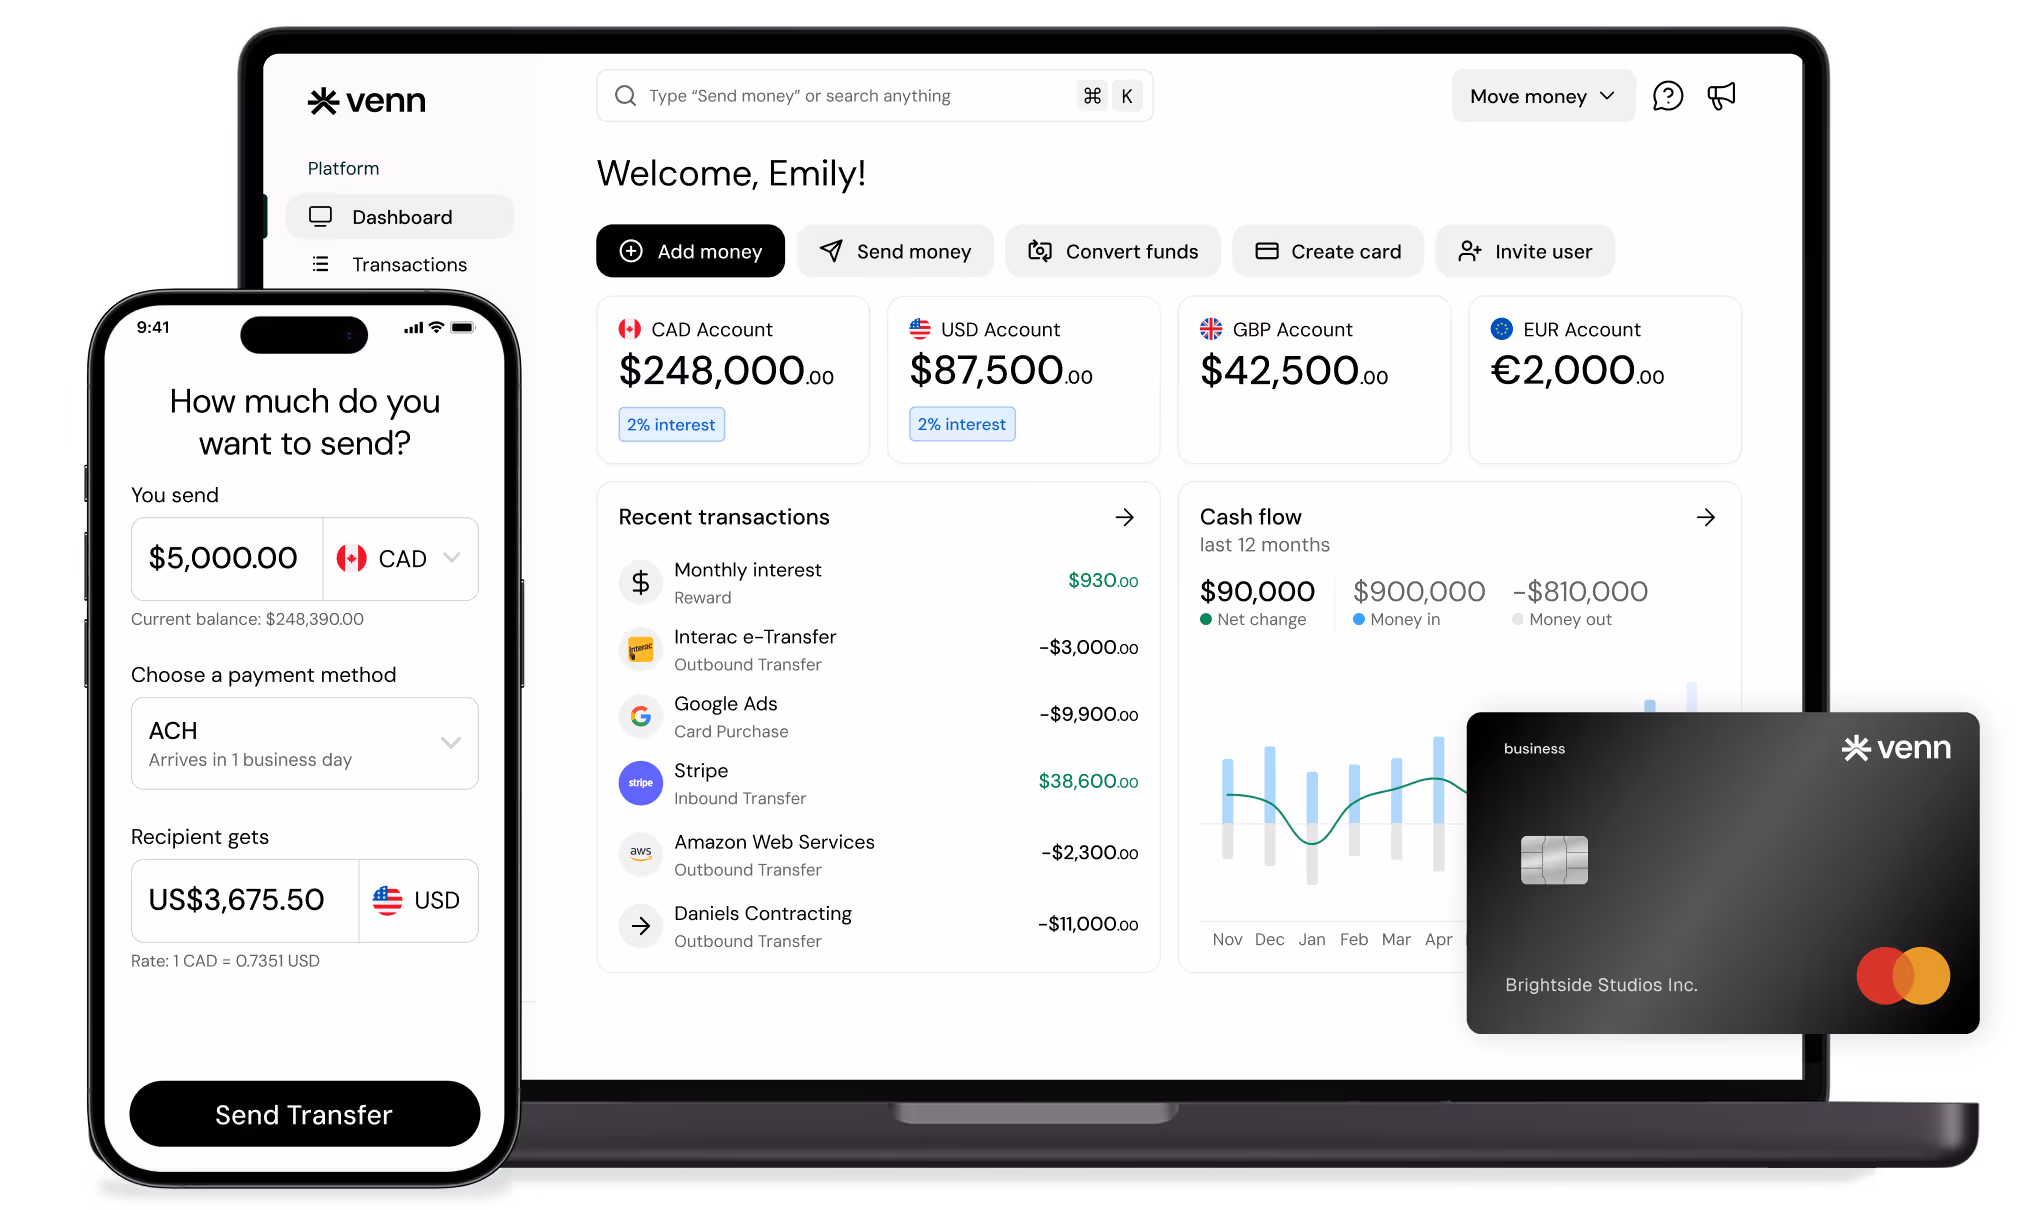
Business banking for Canada
Local CAD and USD accounts, corporate cards with cashback, the lowest FX rates in Canada, free local transfers, and more.
15 Revenue Operations KPI's To Track In 2026
Revenue operations has evolved from a buzzword into the operational backbone of growth-focused Canadian businesses. RevOps aligns Marketing, Sales, Customer Success, and Finance around a single goal: predictable, efficient revenue generation.
In 2026, tracking the right KPIs matters more than ever. Attribution models are messier. Budgets face tighter scrutiny. Investors and leadership teams demand proof that every dollar spent accelerates growth without sacrificing unit economics.
This guide delivers a copy-paste KPI library with consistent definitions, formulas, owners, and data sources. You'll find a scorecard structure ready for your next dashboard build, plus practical guidance on avoiding the data pitfalls that make RevOps metrics unreliable.
One often-overlooked factor in RevOps accuracy: your financial data infrastructure. When expense categorization is clean, CAC calculations become trustworthy. When multi-currency transactions reconcile automatically, international revenue reporting stops being a monthly headache. Modern teams pair RevOps tooling with a business financial stack that includes banking, accounting integration, and spend controls working together.
What Are Revenue Operations (RevOps) KPIs?
RevOps KPIs are decision-grade metrics tied to specific owners and actions. They differ from general metrics because they drive accountability and strategic choices, not just reporting.
Most RevOps programs fail in three predictable ways. First, teams use conflicting definitions across departments. Marketing's "qualified lead" differs from Sales' version, making conversion rates meaningless. Second, organizations track only lagging indicators and miss early warning signals. Third, no single source of truth exists, so every meeting starts with arguments about whose numbers are correct.
How To Choose The Right RevOps KPIs
Don't track all 15 KPIs from day one. Start with 5-7 metrics that match your current priorities, then expand as your operations mature.
Balance your selection across four categories:
• Growth: Pipeline creation, conversion rates, ARR/MRR trajectory
• Efficiency: CAC, payback period, sales productivity metrics
• Durability: Churn rates, GRR, NRR, expansion revenue
• Operational health: SLA adherence, data completeness, handoff latency
Startups should prioritize conversion and efficiency metrics. Scale-ups add retention and expansion tracking. Mature organizations layer in operational health KPIs that measure the RevOps function itself.
RevOps KPI Scorecard For 2026
Use this table as your dashboard backbone. Each KPI includes the essential context for implementation.
| KPI | What It Tells You | Formula | Owner | Source of Truth | Cadence | Common Pitfalls |
|---|---|---|---|---|---|---|
| Lead Response Time | Speed of initial engagement | Time from lead creation to first contact | Sales Ops | CRM + routing tool | Daily | Time zone gaps, manual reassignment delays |
| SLA Adherence | Process discipline | (Leads handled within SLA ÷ Total leads) × 100 | RevOps | CRM | Weekly | Inconsistent SLA definitions |
| MQL → SQL Conversion | Marketing–Sales alignment | (SQLs ÷ MQLs) × 100 | Marketing Ops | Marketing automation + CRM | Weekly | Inflated MQL counts, shifting definitions |
| Cost per Qualified Lead | Channel efficiency | Channel spend ÷ Qualified leads | Marketing Ops | Accounting + CRM | Monthly | Attribution gaps, blended spend |
| Pipeline Coverage Ratio | Forecast risk | Pipeline value ÷ Period target | Sales Ops | CRM | Weekly | Stale pipeline, inflated deal values |
| Win Rate | Sales effectiveness | Closed Won ÷ (Closed Won + Closed Lost) | Sales Ops | CRM | Monthly | Excluding no-decision outcomes |
| Sales Cycle Length | Process efficiency | Days from opportunity create to close | Sales Ops | CRM | Monthly | Backdating, reopened opportunities |
| Pipeline Velocity | Revenue momentum | (Pipeline × Win Rate × ACV) ÷ Cycle Length | RevOps | CRM | Monthly | Mixing definitions, unqualified pipeline |
| Forecast Accuracy | Planning reliability | (Forecasted − Actual) ÷ Actual | Sales Ops | CRM + Billing | Monthly | Sandbagging, last-minute slippage |
| Gross Revenue Retention | Customer durability | (Starting MRR − Churn − Contraction) ÷ Starting MRR | CS Ops | Billing | Monthly | Inconsistent downgrade treatment |
| Net Revenue Retention | Expansion efficiency | (Starting MRR + Expansion − Churn − Contraction) ÷ Starting MRR | CS Ops | Billing | Monthly | Cohort mixing, currency effects |
| Logo Churn Rate | Customer loss velocity | (Churned customers ÷ Starting customers) × 100 | CS Ops | Billing + CRM | Monthly | Excluding involuntary churn incorrectly |
| Expansion Revenue Rate | Growth from existing base | Expansion MRR ÷ Starting MRR | CS Ops | Billing | Monthly | Counting reactivations as expansion |
| CAC Payback Period | Capital efficiency | CAC ÷ (Monthly gross margin per customer) | Finance/RevOps | Accounting + CRM | Monthly | Ignoring gross margin, mixing periods |
| LTV:CAC Ratio | Investment efficiency | Customer LTV ÷ CAC | Finance/RevOps | Accounting + Billing | Quarterly | Using blended churn, overstating LTV |
The 15 Revenue Operations KPIs To Track In 2026
Acquire: Marketing To Pipeline
1. Lead Response Time
Lead response time measures the gap between when a prospect enters your system and when someone contacts them. Research consistently shows that responding within five minutes dramatically increases conversion likelihood.
Track this metric in your CRM combined with your routing tool. Improve performance through automated routing rules, round-robin assignment, and clear SLA expectations. Watch for time zone complications and manual reassignment delays that inflate response times artificially.
2. SLA Adherence
This metric reveals what percentage of leads receive follow-up within your defined service level agreement. It measures process discipline rather than outcomes.
Calculate it as leads handled within SLA divided by total leads. Low SLA adherence often indicates capacity problems, unclear ownership, or broken routing logic. Review weekly to catch process breakdowns before they impact pipeline.
3. MQL To SQL Conversion Rate
The conversion rate from Marketing Qualified Leads to Sales Qualified Leads reveals alignment between marketing programs and sales requirements. Segment this metric by channel and ideal customer profile to identify your most efficient lead sources.
The critical prerequisite: Marketing and Sales must agree on qualification criteria. Document these definitions in a shared metric dictionary. Revisit quarterly as your understanding of ideal customers evolves.
4. Cost Per Qualified Lead
For businesses with shorter sales cycles, Cost per Qualified Lead provides faster feedback than full CAC calculations. It helps you evaluate channel efficiency before deals close.
Track this metric by integrating your accounting data with CRM lead source information. When your financial stack provides clean expense categorization, CPQL calculations become straightforward. Using Venn for marketing spend, for example, lets you categorize expenses at the transaction level and sync them directly to QuickBooks or Xero for accurate channel cost analysis.
Convert: Pipeline To Closed Won
5. Pipeline Coverage Ratio
Pipeline coverage compares your current pipeline value against your revenue target for the period. A ratio of 3x means you have three dollars in pipeline for every dollar you need to close.
Segment this metric by new business versus expansion, and by inbound versus outbound sources. Stale opportunities and inflated deal values are the primary pitfalls. Implement regular pipeline hygiene reviews to maintain accuracy.
6. Win Rate
Win rate measures your ability to convert qualified opportunities into customers. Calculate it as Closed Won divided by the sum of Closed Won and Closed Lost.
Improve win rates through better qualification, sales enablement, and deal desk support for complex negotiations. The most common pitfall: excluding "no decision" outcomes, which artificially inflates your win rate and masks qualification problems.
7. Sales Cycle Length
Measure the days from opportunity creation to close. Shorter cycles improve capital efficiency and reduce forecast uncertainty.
Accelerate cycles through clear stage exit criteria and mutual action plans with prospects. Watch for backdating issues and reopened opportunities that distort historical analysis.
8. Pipeline Velocity
Pipeline velocity combines multiple factors into a single momentum metric. The standard formula: (Pipeline Size × Win Rate × Average Contract Value) ÷ Sales Cycle Length.
This metric helps you understand which lever to pull for faster growth. Increasing pipeline size, improving win rates, raising ACV, or shortening cycles all accelerate velocity. The key pitfall: mixing definitions or including unqualified pipeline in your calculations.
9. Forecast Accuracy
Forecast accuracy measures the gap between predicted and actual revenue. Calculate it as (Forecasted Revenue minus Actual Revenue) divided by Actual Revenue.
Improve accuracy through disciplined stage probability assignments and clear commit criteria. Sandbagging and last-minute deal slippage are the primary challenges. Weekly forecast reviews with deal-level scrutiny help maintain discipline.
Retain And Expand: Customer To Revenue Durability
10. Gross Revenue Retention
GRR measures revenue durability without counting expansion. It answers: "Of the revenue we started with, how much did we keep?"
Calculate it as Starting MRR minus Churn minus Contraction, divided by Starting MRR. A GRR of 90% means you retained 90 cents of every dollar, before any upsells or expansions. This metric reveals your core product's stickiness.
11. Net Revenue Retention
NRR adds expansion revenue to the GRR equation. It shows whether your existing customer base generates more revenue over time.
NRR above 100% means your customer base grows even without new logos. This metric matters enormously for capital efficiency. Companies with high NRR can grow faster with less sales investment. Watch for cohort mixing and currency conversion effects that distort multi-currency calculations.
For businesses operating internationally, clean currency handling becomes essential. Venn's multi-currency accounts in CAD, USD, GBP, and EUR help you track revenue and expenses in local currencies, making NRR calculations across markets more accurate.
12. Logo Churn Rate
Logo churn counts the percentage of customers lost, regardless of their revenue contribution. Calculate it as churned customers divided by starting customers.
Reduce churn through better onboarding, regular business reviews, and proactive support. Distinguish between voluntary churn (customer choice) and involuntary churn (payment failures). Each requires different intervention strategies.
13. Expansion Revenue Rate
This metric tracks revenue growth from existing customers through upsells, cross-sells, seat additions, or usage increases.
Calculate it as Expansion MRR divided by Starting MRR. Avoid counting reactivations or one-time charges as expansion revenue. Clean billing data is essential for accurate tracking.
Efficiency And Finance Alignment
14. CAC Payback Period
CAC payback measures how many months it takes to recover your customer acquisition investment. Calculate it as CAC divided by monthly gross margin per new customer.
This metric connects RevOps directly to cash flow reality. A 12-month payback means you need 12 months of gross margin from each customer before you break even on acquisition costs.
Improve payback through pricing optimization, faster onboarding, and sales efficiency gains. The critical requirement: accurate gross margin data. When your accounting integration flows cleanly from your financial stack to your reporting tools, payback calculations become trustworthy.
15. LTV:CAC Ratio
Lifetime Value to Customer Acquisition Cost measures overall investment efficiency. Calculate LTV using gross margin-adjusted revenue and cohort-based churn rates for accuracy.
A ratio of 3:1 is often cited as healthy, but context matters. Early-stage companies may operate at lower ratios while building market position. Mature businesses should see higher ratios as they optimize operations.
The primary pitfall: overstating LTV by using blended churn rates that mask segment differences. Use cohort analysis for more accurate projections.
How To Operationalize RevOps KPIs In 2026
Set Owners, Cadence, And Single Source Of Truth
Every KPI needs a named owner responsible for accuracy and improvement. Establish a weekly RevOps review for operational metrics and a monthly executive review for strategic KPIs.
Create a metric dictionary documenting definitions, formulas, and data sources. Implement change control so definitions don't drift without explicit approval.
Build A Minimal Data Model
Your dashboard accuracy depends on consistent underlying data. Ensure your systems capture these essential fields:
CRM requirements: Lead source, lifecycle stages, opportunity create and close dates, deal amount, stage history, owner, customer segment
Billing and accounting requirements: Invoice date, payment date, refunds and credits, currency, customer ID
Customer Success requirements: Health score inputs, adoption events, ticket volume, time to first response
Where Venn Fits In A Modern RevOps And Finance Stack
RevOps metrics become trustworthy when your financial data infrastructure supports accurate, timely reporting. Venn serves as the business financial stack layer that connects revenue operations to cash reality.
Spend visibility and control: Venn's expense management features help teams categorize go-to-market expenses cleanly. When your marketing and sales spend flows through a system with built-in categorization and OCR receipt capture, CAC and payback calculations become straightforward rather than month-end scrambles.
1% unlimited cashback: Every dollar of operating spend earns 1% back, creating a meaningful baseline return on the expenses you're already tracking for RevOps purposes. This compounds across your entire go-to-market budget.
Multi-currency operations: For businesses selling or paying internationally, Venn's local currency accounts reduce FX friction and make revenue reporting across markets more accurate. You can hold, send, and receive in CAD, USD, GBP, and EUR without constant conversion headaches.
Accounting workflow integration: Direct connections to QuickBooks and Xero streamline reconciliation and accelerate month-end close. Faster close means fresher KPI data. When your financial data syncs automatically, your RevOps team spends less time chasing numbers and more time improving them.
Payments and payables context: Modern RevOps extends beyond "Closed Won." Cash collection timing and payment efficiency affect your true revenue picture. Free unlimited Interac e-Transfer® for vendor payments and competitive international transfer rates help you manage the full revenue cycle.
Sign up for a Venn account to strengthen the financial foundation of your RevOps measurement.
Conclusion
Effective RevOps measurement in 2026 requires more than a list of KPIs. It demands consistent definitions, clear ownership, reliable data sources, and alignment between revenue operations and financial reality.
Start with 5-7 metrics that match your current priorities. Document definitions in a shared metric dictionary. Assign owners and establish review cadences. Build your minimal data model so dashboards reflect truth rather than aspirations.
The companies that win in 2026 will be those that treat RevOps measurement as operational infrastructure, not a reporting exercise. Clean financial data, integrated systems, and disciplined governance separate high-performing revenue teams from those still arguing about whose numbers are correct.
Sign up for a Venn account to build the financial infrastructure your RevOps team needs.
FAQ
Q: What are the most important RevOps KPIs for a startup in 2026?
A: Focus on conversion metrics (MQL to SQL, win rate), efficiency metrics (CAC payback, sales cycle length), and one retention metric (logo churn or GRR). Start with 5–6 KPIs you can measure accurately before expanding.
Q: What's the difference between GRR and NRR?
A: GRR measures revenue retained from existing customers without counting expansion. NRR includes expansion revenue, showing total revenue change from your existing base. GRR reveals product stickiness, while NRR shows growth efficiency.
Q: How do I measure pipeline velocity correctly?
A: Use a consistent formula: (Pipeline Size × Win Rate × Average Contract Value) ÷ Sales Cycle Length. The key is consistency—pick one formula and apply it uniformly. Exclude unqualified pipeline to avoid inflating the metric.
Q: How often should RevOps KPIs be reviewed?
A: Operational metrics like lead response time and SLA adherence warrant weekly review. Strategic metrics like NRR, CAC payback, and LTV:CAC fit monthly or quarterly executive reviews. Match the cadence to decision-making cycles.
Q: Which systems should be the source of truth for RevOps reporting?
A: Use your CRM for pipeline and conversion metrics, billing or subscription management systems for retention and expansion metrics, and accounting software for cost-based metrics like CAC and payback. The key is designating one source per metric and enforcing it consistently.
---
**Disclaimer:** This publication is provided for general information purposes and does not constitute legal, tax or other professional advice from Venn Software Inc or its subsidiaries and its affiliates, and it is not intended as a substitute for obtaining advice from a financial advisor or any other professional. We make no representations, warranties or guarantees, whether expressed or implied, that the content in the publication is accurate, complete or up to date.
This publication is provided for general information purposes only and does not constitute legal, tax, financial, or other professional advice from Venn Software Inc., its subsidiaries, or its affiliates, and is not a substitute for advice from a qualified professional. All comparisons and competitor information reflect publicly available information believed accurate as of April 7, 2026; features, pricing, rates, and terms referenced are subject to change and may differ at the time you read this. All product names, logos, and brands referenced are the property of their respective owners; their mention does not imply affiliation with or endorsement by Venn. Any comparative statements reflect Venn's views and are provided to help readers evaluate options. We make no representations, warranties, or guarantees, express or implied, that the content is accurate, complete, or up to date.

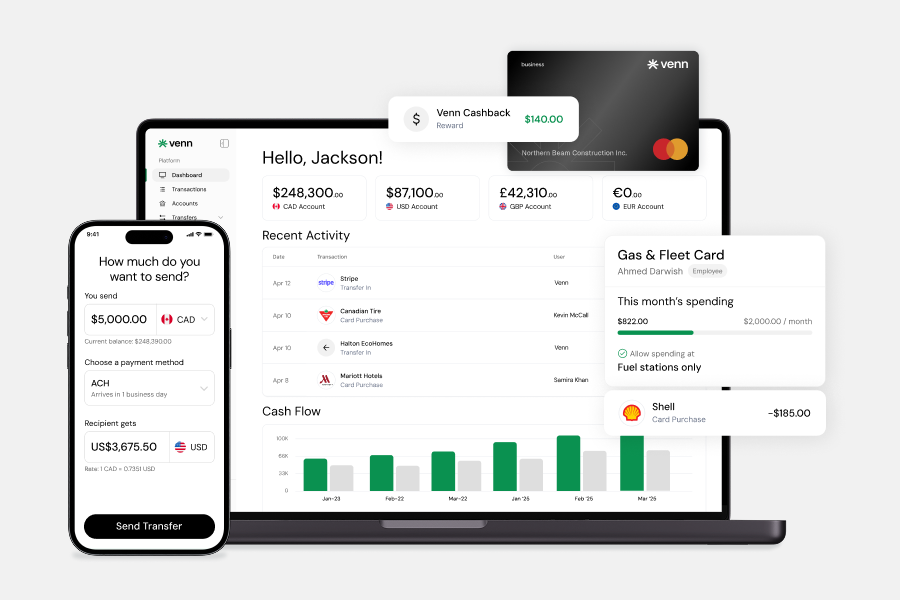
Venn is all-in-one business banking built for Canada
From free local CAD/USD accounts and team cards to the cheapest FX and global payments—Venn gives Canadian businesses everything they need to move money smarter. Join 10,000+ businesses today.
Frequently asked questions
Everything you need to know about the product and billing.
Join 10,000+ businesses banking with Venn today
Streamline your business banking and save on your spend and transfers today
No personal credit check or guarantee.